
Oriole Insights' Fear & Greed Index Meaning
The Index itself is embedded in general trading theory. The original doctrine claims the core idea is “buy low — sell high.” All the surrounding knowledge focuses on variations on how to know when the asset price is low and when it reaches its top. Understanding other actors' actions plays a central role in this discourse, as other active users determine your trades.
Fear & Greed Index is called to make a general snapshot of audience trading preferences. It shows whether the average trader feels “bullish” or “bearish” based on the buy and sell trades ratio.
Various Fear & Greed Indexes
The Index is popular in TradFi and Crypto. In a traditional economy, many indexes focus on stock and derivatives trading. One example is the CNN Fear & Greed Index. It comprises seven parts: market momentum, stock price strength, stock price breadth, put and call options, junk bond demand, market volatility, and haven demand. They can be attributed to exchanges like NASDAQ or spheres like Gaming stocks.

The most popular Crypto Fear & Greed Index is provided by the website Alternative. It analyzes six directions, each having a specific weight in the index. They include Volatility (25 %), Market Momentum/Volume (25%), Social Media (15%), Surveys (15%) (currently paused), Dominance (10%), and Trends (10%).


Fear & Greed Index and Price Dynamics
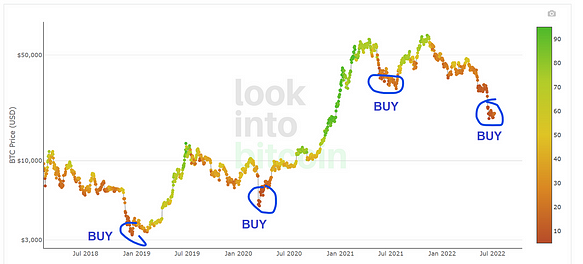
The index is used to predict price change but also depends on it. This twofold relation requires skill to make sense of it. The classic reading of the Fear & Greed Index tells us that extremely high greed should be seen as a moment to sell and dollarize your assets. Conversely, extremely high fear is interpreted as a sign to buy.
In our case, the user can compare the overall and each asset’s indices. This will help him assess better whether he is standing on lows or highs.
Oriole Insights Fear&Greed Index
The core idea of Oriole’s index is to capture authentic data on user’s preferences. It enables traders to see the dominant tendency based on people’s sentiments. Oriole’s benefit also involves making people make much riskier predictions. A trader uses internal currency instead of its assets to go after a vote he wouldn't have made while risking his dollars.
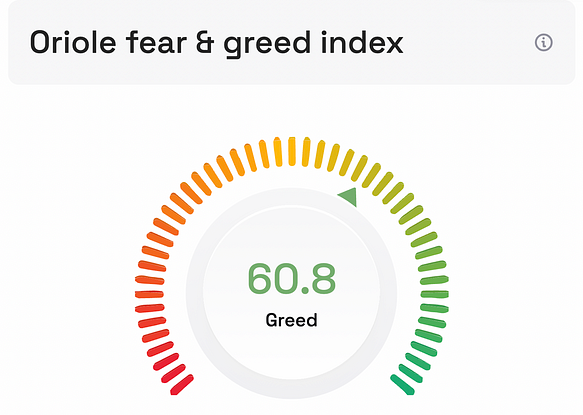
The Index will count the number of votes that predict a price increase as a representation of the “GREED” power, while the number of votes that predict a price decrease will be represented by “FEAR.” Oriole Insights also provides an overall index and specific indexes for each asset. It is an aggregated discrete number representing the sum of all the projects' votes. Yet, there is also a problem with such a straightforward approach — it doesn’t provide adequate updates on the situation. The index should always be up-to-date. Thus, we should highlight the recency of the votes. To capture this, each vote will be calculated with an adjustment to the placement date. This way, rapid spikes in sentiment will be adequately displayed on the index.
For example, let’s imagine there are 5 votes on Ethereum. All of them are made on day 1, constituting 1“UP” and 4 “DOWN” 90-day votes. This will place an index of 20%, which falls into the “high fear” section. Let’s now imagine that on day 44 there are additional 2 votes placed. Both of them are “UP”. This will make a sum of 3 “UP” to 4"DOWN” votes, which should have been added up to 43%, falling to the “moderate fear” section. However, logic tells us that 2 votes made on the latter date should have more weight, as they imply the changing situation and the new belief in growth. That’s why our index won’t be 43% but 45.3% as we adjust the index according to our sophisticated formula.
Another tool is the sentiment scale, representing the proportion of UP/DOWN predictions among all the open votes in the last seven days. Oriole Insights also provides a sentiment scale for each asset.
Conclusion
Overall, this detailed approach is called to provide users with the maximum available data. This way, each can analyze all the information and place sophisticated votes. This allows for testing various trading strategies and understanding complicated price dynamics.